Shopping — Data & Analytics
A catalogue of Singapore shopping centres, their corporate owners, and the shops inside them with a unified scope-of-business taxonomy. Six analytical lenses sit on top.
Please note. Everything on this sub-site describes what was publicly discoverable on each operator’s store directory / REIT disclosure at the time of our snapshot. Tenant mixes change frequently, some operators publish curated subsets only, and several derived figures are estimates. Nothing here is an audit, ranking, or scorecard of any mall, operator, or brand. If you spot anything out of date or want to flag a correction, please get in touch — we will update with a citation. Full terms: Disclaimer · Licence (CC BY 4.0).
Start here
→ 10 Fun Questions About Singapore Malls — bubble-tea capital, the secret-clone malls, the apocalypse-bunker mall, and more.
Reports
| Report | What it answers |
|---|---|
| Overview | Coverage summary: shops by scope, malls by shop count, owners |
| Chain ubiquity | Which brands appear in the most malls (retail and F&B leaderboards) |
| Owner / region breakdowns | Counts by owner group, planning region, and grocery anchor |
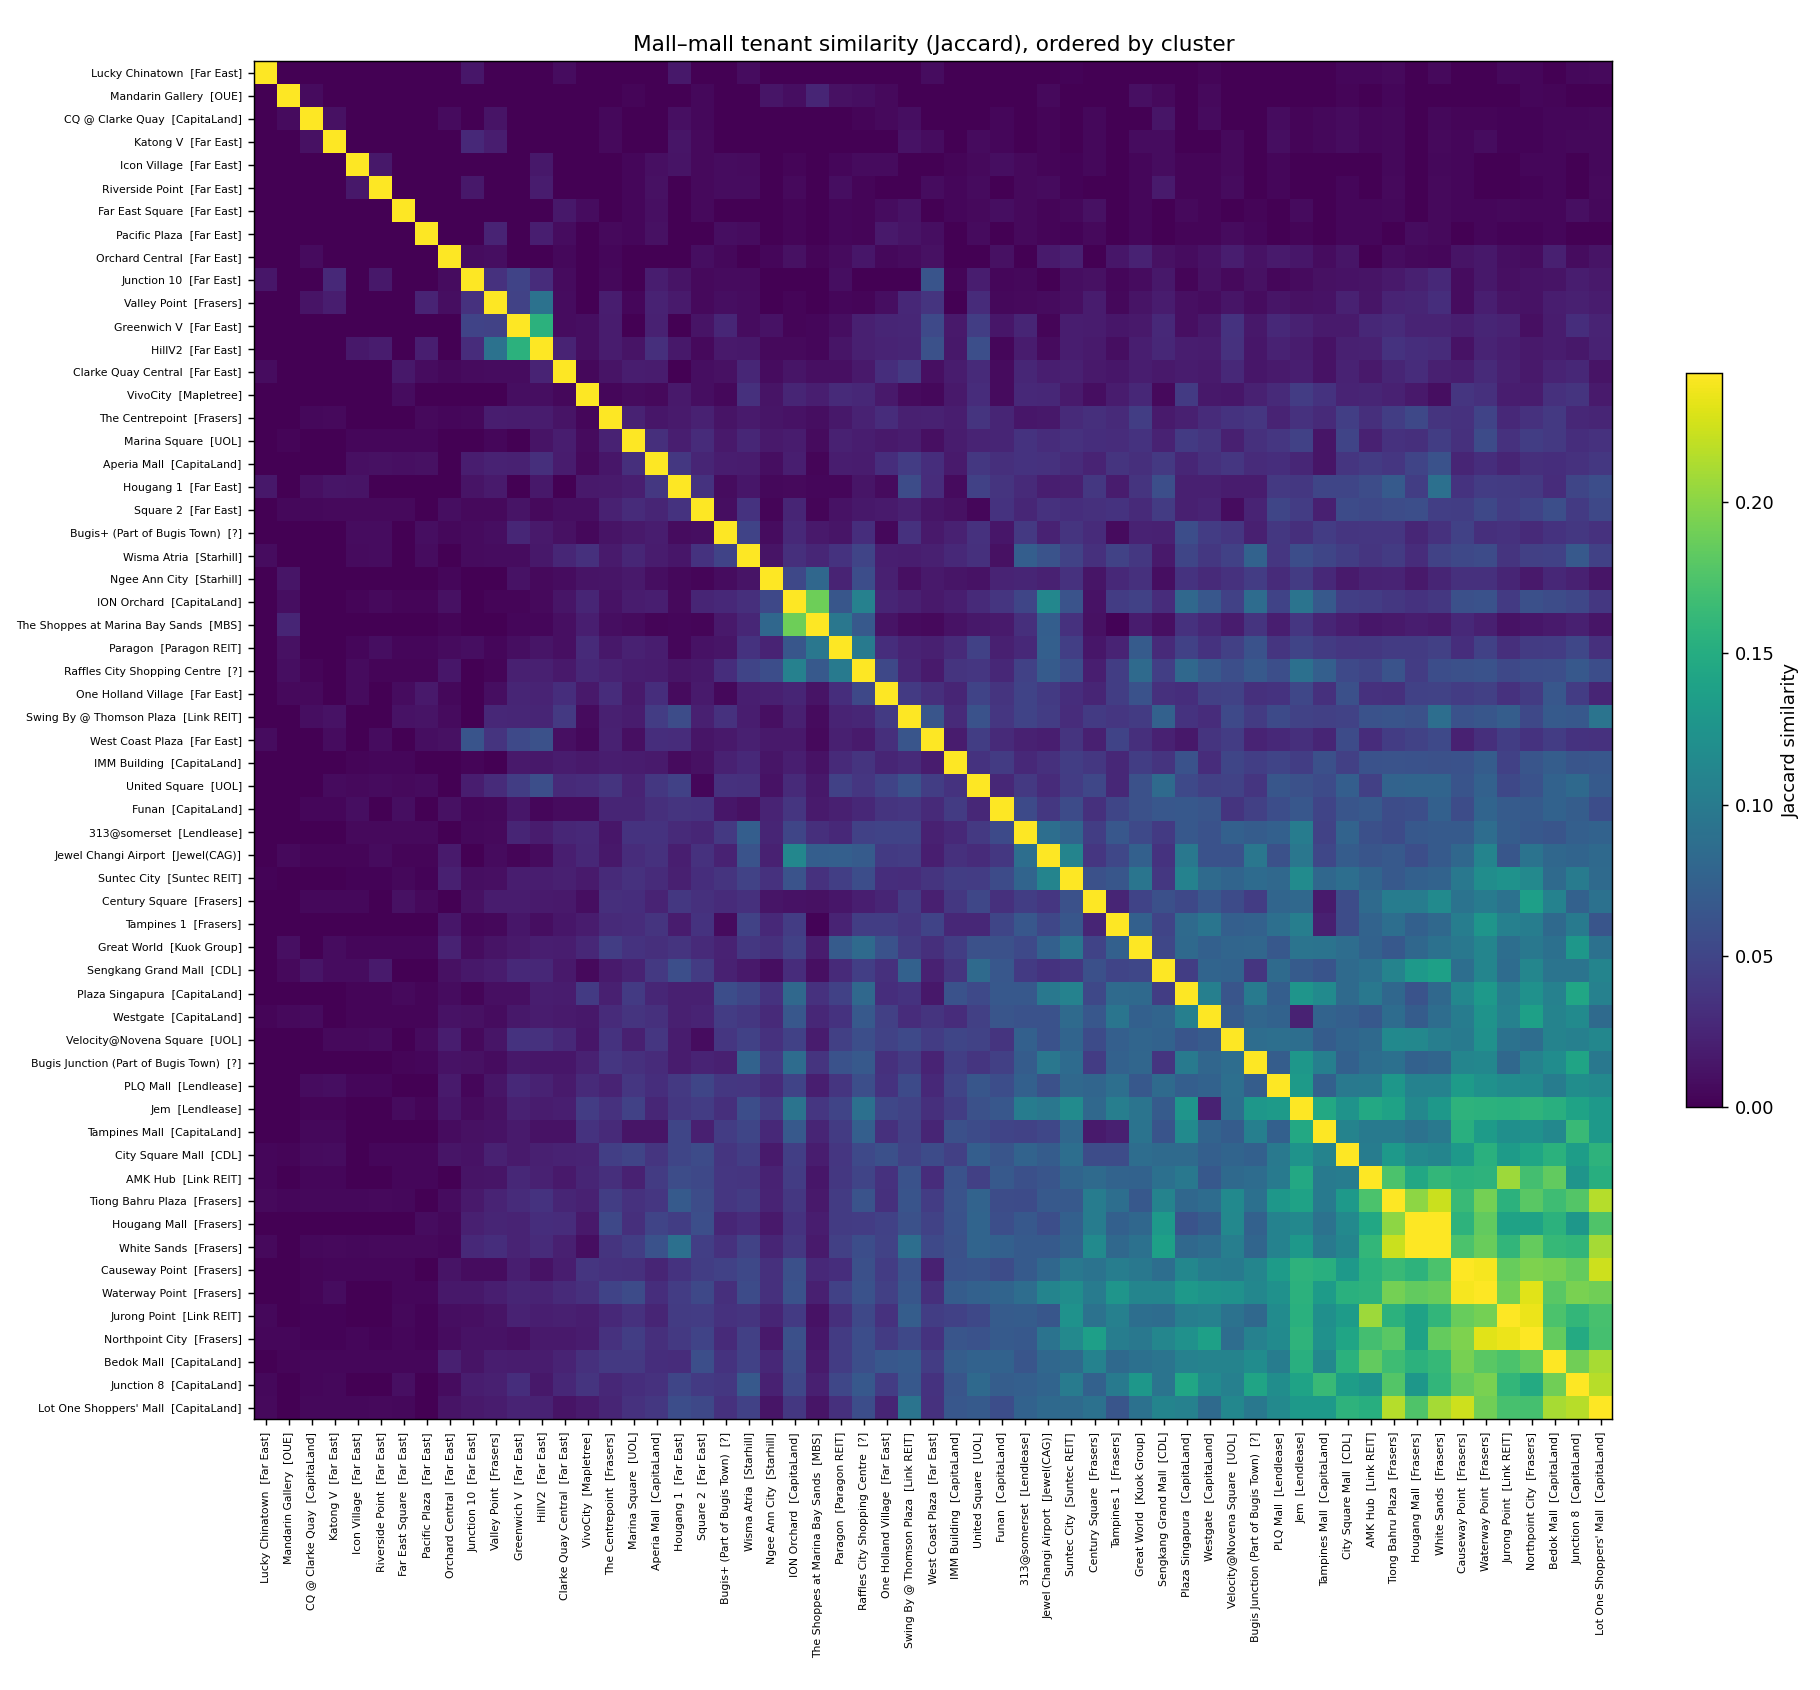
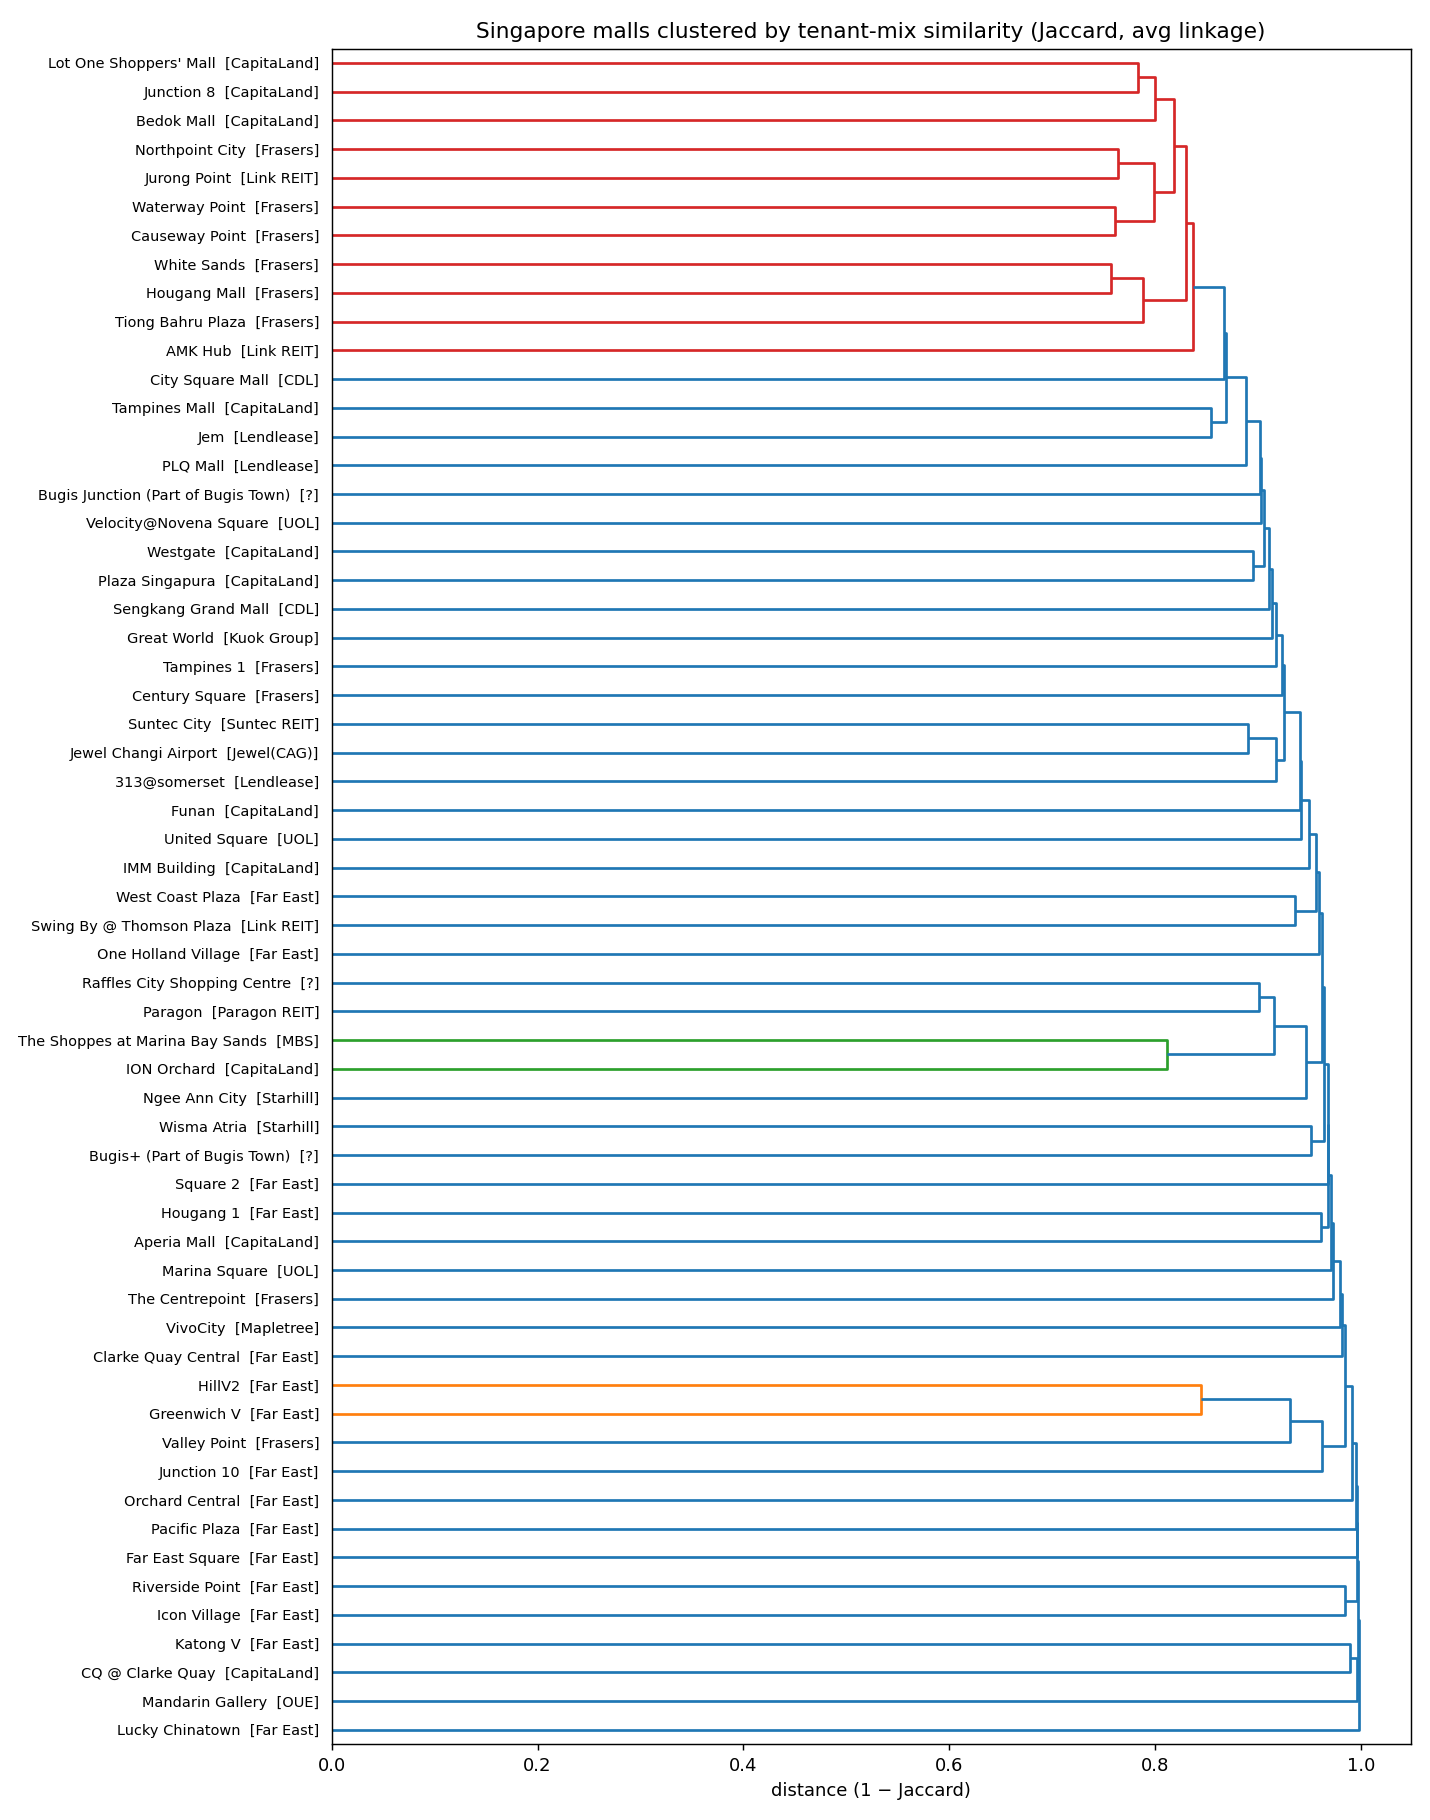
| Mall similarity | Jaccard / cookie-cutter / ARI on tenant mix — which malls overlap most |
| F&B cuisine mix | Food & beverage shops bucketed into cultural cuisines |
| Brand provenance | Singapore-origin vs. foreign brands across the dataset |
| REIT financials | Per-mall shop count vs. NPI / yield for each REIT-owned property |
Visualisations
 |
 |
Data
| File | Rows | Description |
|---|---|---|
data/malls.json / .csv |
75 | Every shopping centre: corporate owner, owner group & type, address, postal code, planning region, nearest MRT, lat/long, shop & F&B counts |
data/stores.json / .csv |
4,258 | Every catalogued shop: name, mall, owner group, unit, level, scope of business, F&B flag, halal flag, description, website |
data/malls_registry.json |
73 | Raw research-assembled registry (owner / geo / transit) before merging |
data/top_shops_retail.csv, top_shops_fnb.csv |
— | Chain-ubiquity leaderboards |
data/mall_similarity.csv, mall_cookiecutter.csv |
— | Pairwise Jaccard and cookie-cutter scores |
data/mall_financials.csv |
— | Per-mall NPI / yield (REIT properties only) |
data/fnb_cuisine.csv |
— | F&B shops with cultural cuisine bucket |
data/provenance.csv |
— | Per-brand SG / foreign tag |
data/*_stores.json, *_malls.json |
— | Per-operator intermediate outputs (one file per operator) |
stores schema
name, mall, owner_group, unit, level, scope_of_business, raw_category,
subcategory, is_fnb, is_halal, description, website, source
scope_of_business is one of 14 unified categories: Food & Beverage, Fashion & Accessories, Beauty & Wellness, Services, Department/Value/Outlet, Hobbies/Leisure/Entertainment, Health & Pharmacy, Sports & Fitness, Home & Living, Electronics & Technology, Kids & Children, Supermarket & Convenience, Jewellery & Watches, Books & Stationery. raw_category keeps each operator’s original label.
Coverage
- 86 shopping centres across 22 corporate owner groups (CICT/CapitaLand, FCT/Frasers, Far East, Mapletree/MPACT, Lendlease, CDL, Allgreen, Paragon REIT, UOL, Suntec REIT, Starhill, SingLand, Link REIT, MBS, Jewel, …) — each with owner, address, region, transit.
- 59 centres have full shop-level listings (9,158 shops, 3,332 F&B). Largest portfolios: CapitaLand (14 malls, 2,428 shops), Frasers (10 malls, 1,741 shops), Far East (15 malls, 831 shops), Link REIT (3 malls, 640 shops), Suntec City (396), Lendlease 313/Jem/PLQ (586), VivoCity (378), MBS Shoppes (214).
- The remaining ~40 centres are catalogued at the registry level (owner + geo + transit) but without shop lists.
Limitations
- Snapshot dated 2026-05-27. Tenant mixes change frequently.
- VivoCity — now catalogued at 378 stores; an earlier capture produced only ~89.
- City Square has shop names + units but per-shop category only for F&B.
- All sources are public store directories.
Support
If this dataset is useful to you, you can support continued maintenance: Buy me a coffee ☕.