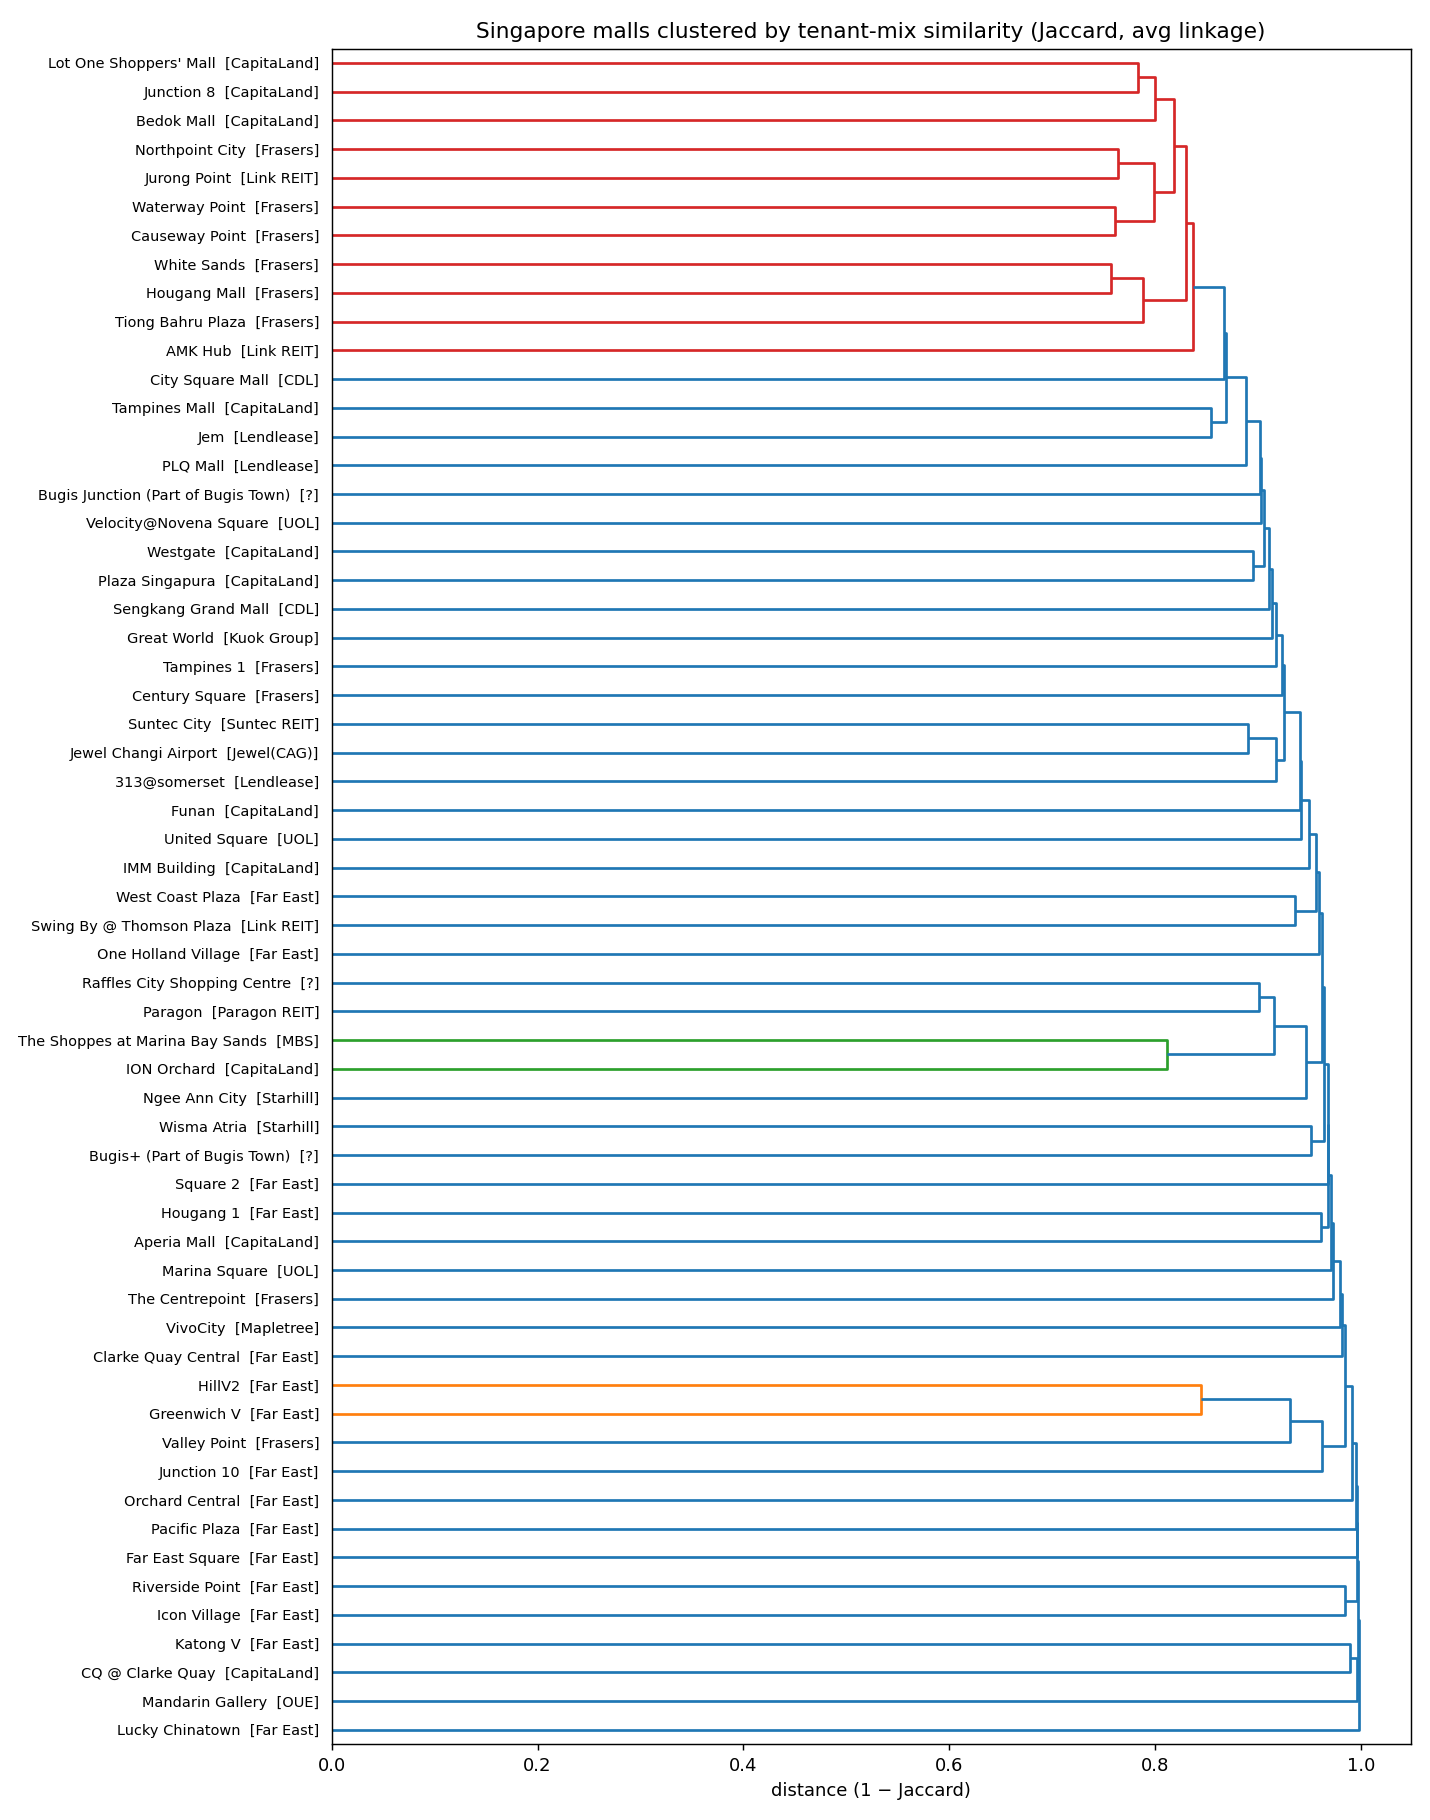
How cookie-cutter are Singapore’s malls?
Tenant-mix similarity across 59 malls with ≥15 listed brands. Brands normalised + alias-merged; similarity = Jaccard on brand sets.
← back to shopping · back to the index
Please note. The labels “cookie-cutter” and “distinctive” here are purely descriptive of brand-set overlap in our scraped data — they are not judgments about a mall’s positioning, design quality, customer experience, or strategic intent. A high chain-share simply means the brand list overlaps a lot with other malls; a low one means a mall’s tenant mix is more unusual. Both can be desirable depending on what the mall is positioned to do. Operators are welcome to flag missing or out-of-date entries; we will update with a citation.
- Overall mean pairwise Jaccard: 0.038 — two random malls share ~4% of their combined tenant set.
- Chain-share = fraction of a mall’s brands that also appear in ≥1 other mall. High = templated; low = distinctive.
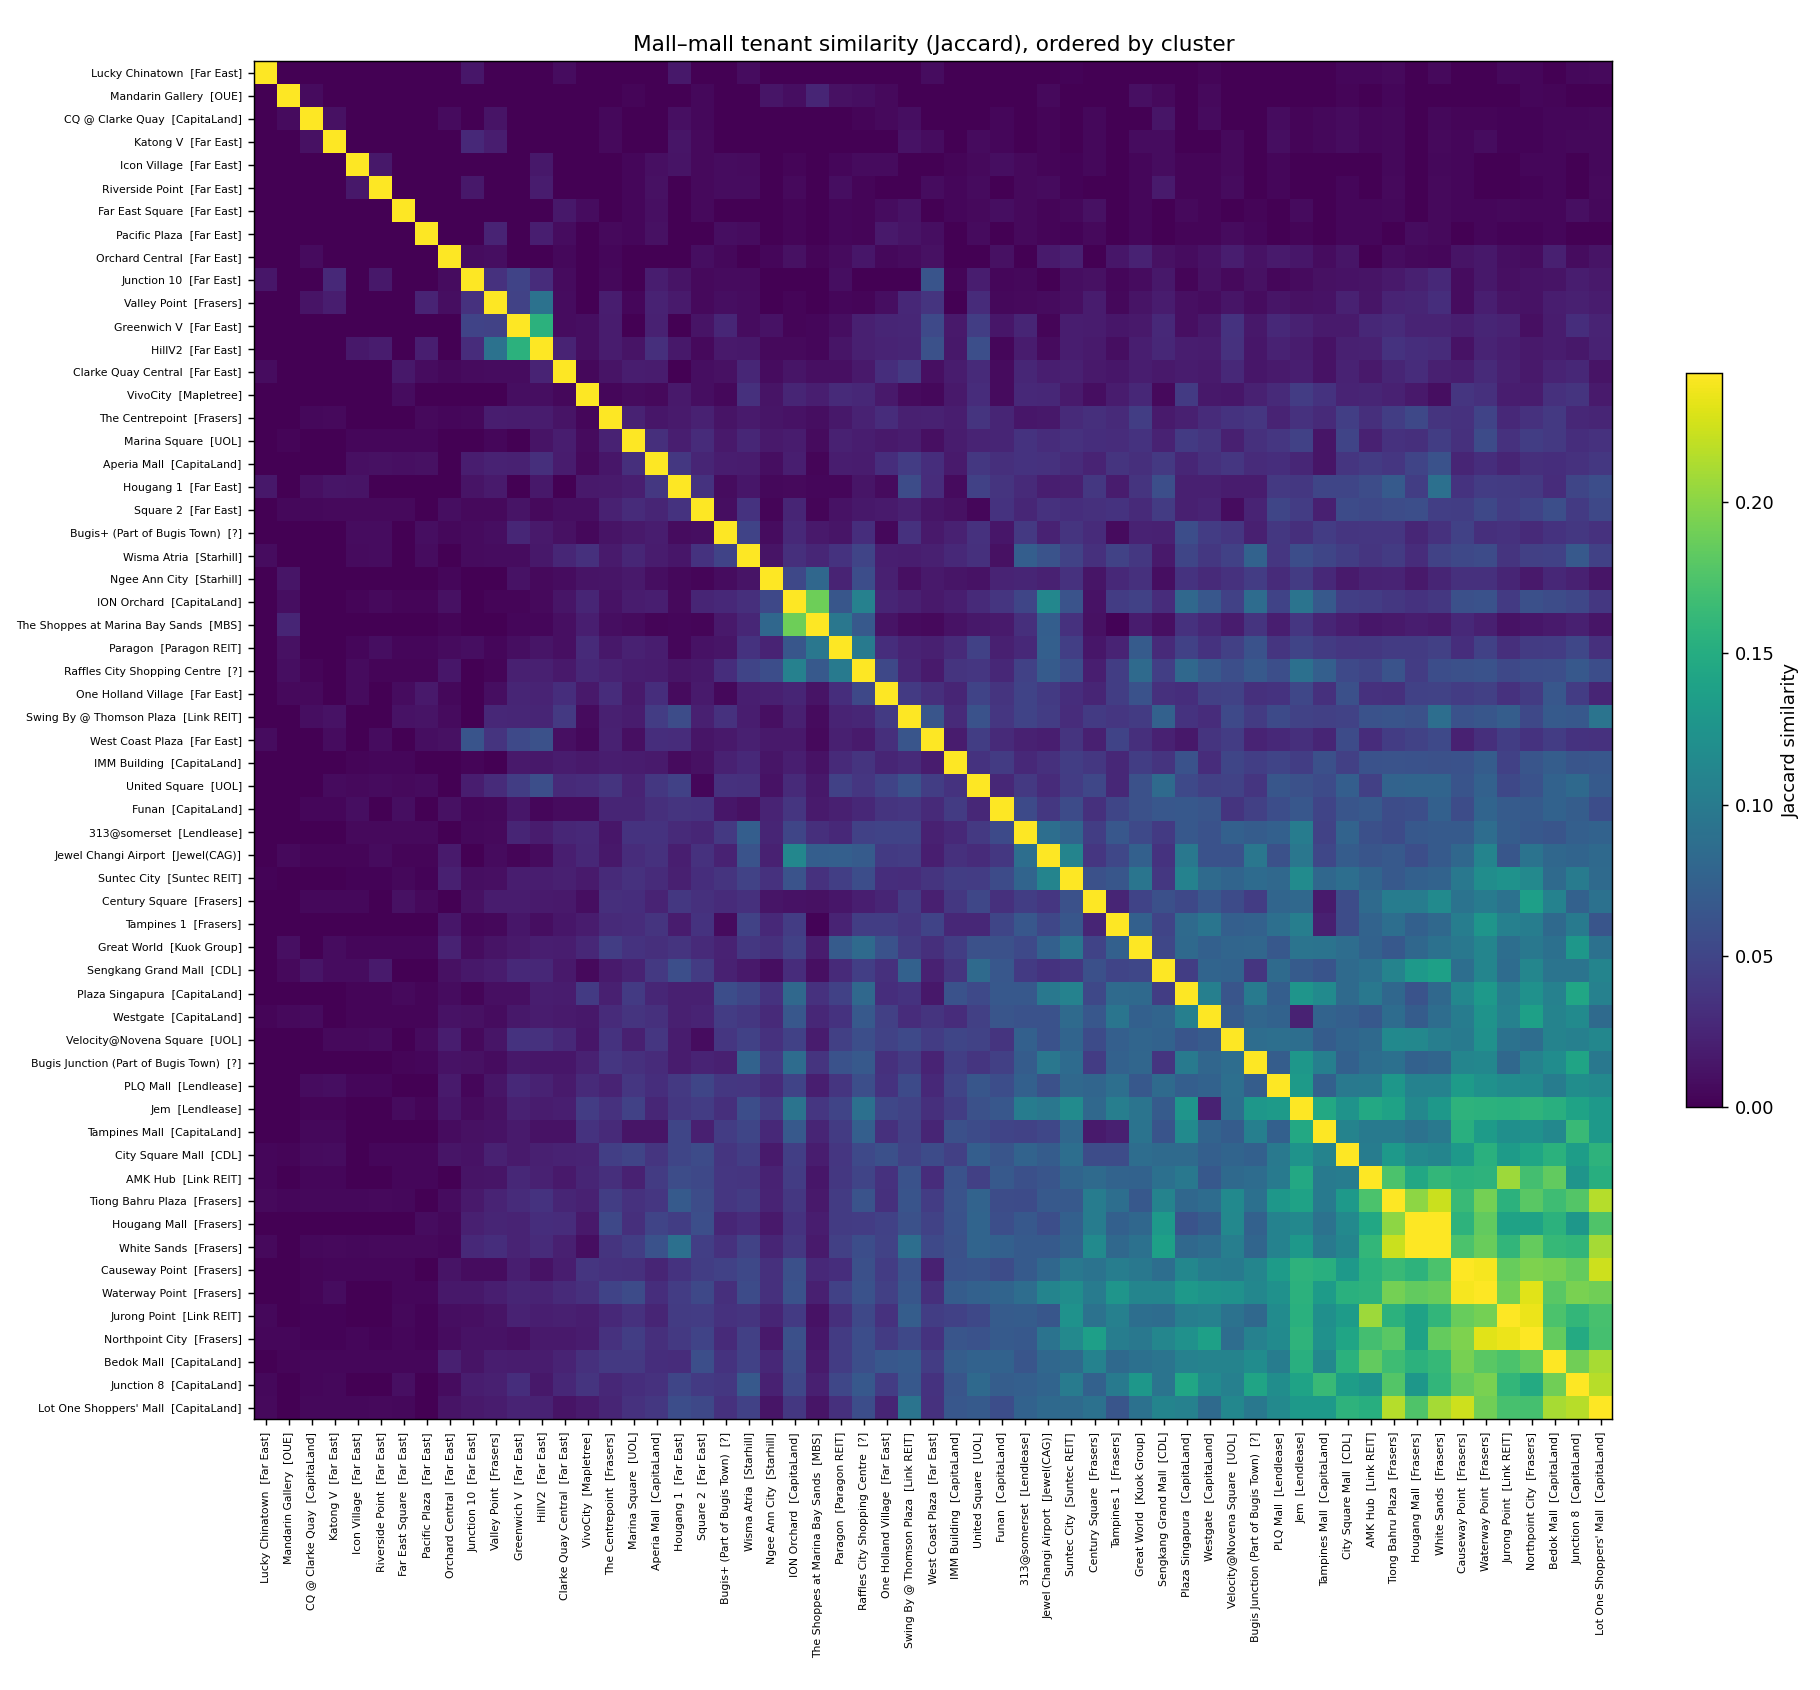
Tenant-mix similarity heatmap
Each cell is the Jaccard similarity between two malls’ brand sets. Darker = more shared brands. Hover for exact values.
Chain-share by mall — sortable
Click any column to sort; type to filter. The colour wash on the chain-share column highlights heartland templates (red) vs distinctive malls (green).
Homogeneity by positioning
| Region bucket | Malls | Avg chain-share |
|---|---|---|
| Suburban / Heartland | 34 | 69% |
| Unknown | 3 | 62% |
| Orchard belt | 10 | 49% |
| Downtown / Central | 12 | 34% |
Does the owner predict the tenant cluster?
Comparing owner vs region/positioning as predictors of tenant mix:
| Predictor | Within-group sim | Between-group sim | Lift | Nearest-neighbour same-group | Cluster agreement (ARI) |
|---|---|---|---|---|---|
| Owner | 0.046 | 0.037 | 1.24× | 39% | -0.047 |
| Region | 0.057 | 0.027 | 2.12× | 59% | 0.051 |
Within-group sim = avg Jaccard between malls sharing the label; lift = within/between. ARI: cluster the malls (avg-linkage on Jaccard distance) and score agreement with the labelling (0 = chance, 1 = perfect).
See mall_dendrogram.png and mall_heatmap.png for the static clustering visuals, and data/mall_similarity.csv for the raw matrix.